This page has key statistics about liver cancer. This information is about liver cancer in the UK, so it isn’t a good guide to what may happen to an individual person.
Liver cancer deaths
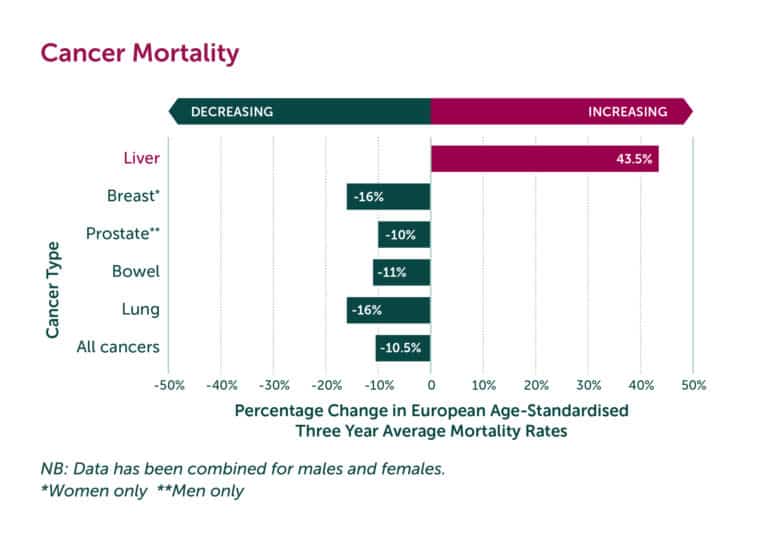
Over the past decade, the number of people dying from liver cancer has risen the fastest out of all the 20 most common types of cancer in the UK.1
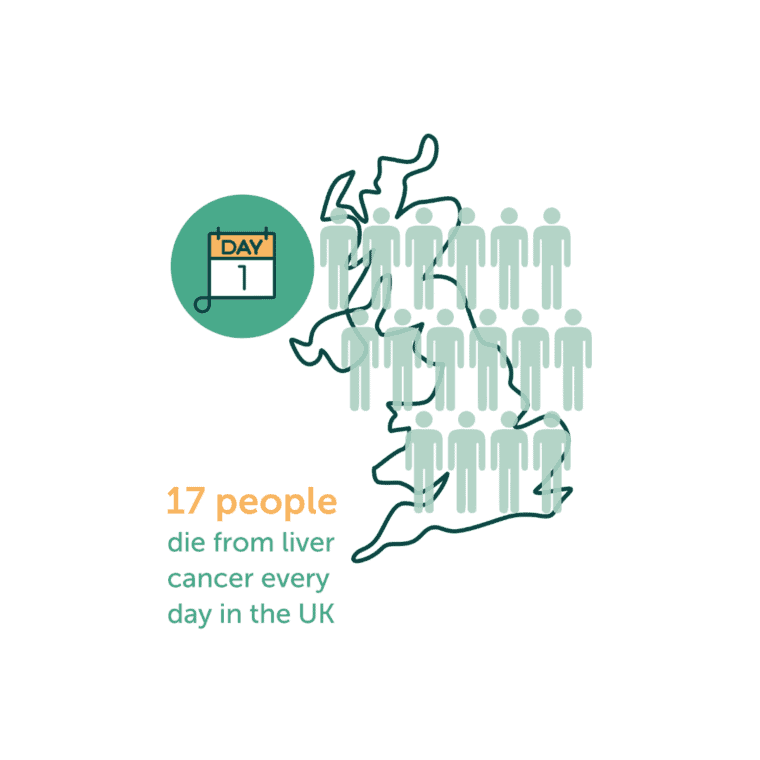
Each day, 17 people in the UK die from liver cancer, which is around 6,200 people every year.2 In 2023 the number of deaths by UK nation were:
- 5,254 in England 3
- 193 in Northern Ireland 4
- 654 in Scotland 5
- 362 in Wales 3
- 6,463 in the UK
Cases of liver cancer
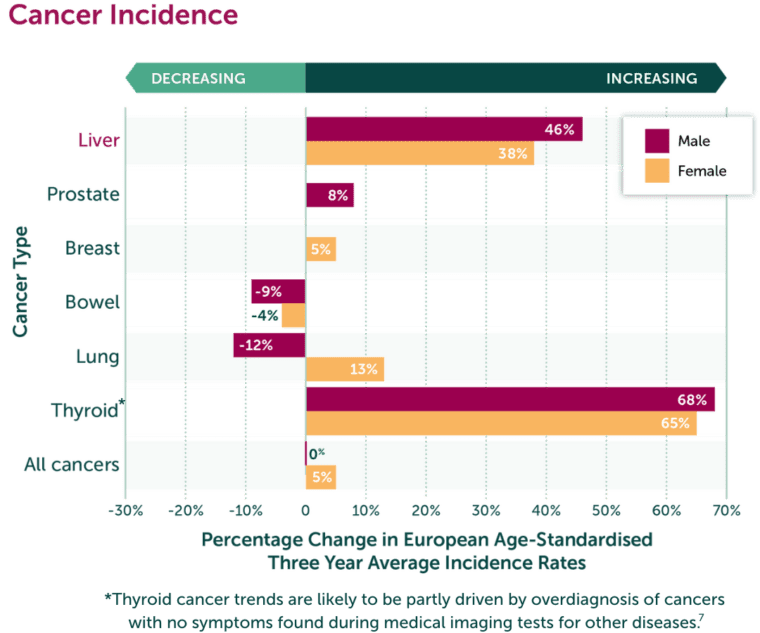
The number of new cases (incidence) of liver cancer has risen the second fastest amongst the 20 most common types of cancer over the past decade in the UK.6
In numbers, this amounts to 17 new liver cancer diagnoses each day, and around 6,000 each year.8
According to the latest available data for each UK nation, the number of new yearly liver cancer cases by nation are:
- 5,457 in England (2020)9
- 361 in Wales (2019)11
- 600 in Scotland (2017)10
- 132 in Northern Ireland (2020)12
Cancer cases by UK region
A range of things affect differences in cancer rates between regions. These include the level of deprivation, with liver cancer being more common in more deprived areas. 32
| Region | Age standardised rate in men |
Age standardised rate in women |
Cases in men |
Cases in women |
Total cases |
| North West | 17.4 | 7.2 | 583 | 279 | 862 |
| North East | 16.7 | 7.0 | 206 | 106 | 312 |
| London | 15.5 | 7.1 | 447 | 242 | 689 |
| Yorkshire and the Humber |
14.4 | 6.3 | 354 | 183 |
537 |
| West Midlands | 14.2 | 7.1 | 372 | 221 |
593 |
| South West | 14.1 | 6.6 | 411 | 227 | 638 |
| South East | 12.9 | 5.9 | 551 | 307 | 858 |
| East Midlands | 12.8 | 5.9 | 291 | 153 | 444 |
| East | 11.2 | 5.6 | 331 | 193 | 524 |
Rates per 100,000 people. All rates were directly age-standardised to the European Standard Population (2013). Site: Liver And Intraheptic Bile Duct Cancer (ICD-10 C22). Diagnosis year: 2020.
Source: NHS Digital (2022). Cancer Registration Statistics, England 2020. Accessed: 15/09/2023. https://digital.nhs.uk/data-and-information/publications/statistical/cancer-registration-statistics/england-2020.
| Region | Age standardised rate in men |
Age standardised rate in women |
Cases in men |
Cases in women |
Total cases |
| Belfast HSCT | 19.3 | 6.2 | 25 | 10 | 35 |
| South Eastern HSCT |
12.8 | 4.8 | 20 | 9 | 29 |
| Western HSCT | 11.5 | 3.7 | 14 | 5 | 19 |
| Northern HSCT | 11.4 | 5 | 23 | 12 | 35 |
| Southern HSCT | 10.1 | 4.8 | 14 | 8 | 22 |
Rates per 100,000 people. All rates were directly age-standardised to the European Standard Population (2013). Site: Liver And Intraheptic Bile Duct Cancer (ICD-10 C22). Diagnosis year: 2016-2020.
Source: Northern Ireland Cancer Registry. Liver cancer statistics: 1993-2020. Accessed: 02/09/2023 https://www.qub.ac.uk/research-centres/nicr/CancerInformation/official-statistics/BySite/Livercancer/ .
| Region | Age standardised rate in men |
Age standardised rate in women |
Cases in men |
Cases in women |
Total cases |
| South East of Scotland |
19.5 | 7.7 | 138 | 66 | 204 |
| West of Scotland |
18.8 | 8.5 | 213 | 117 | 330 |
| North of Scotland |
13.9 | 6.7 | 97 | 55 | 152 |
Rates per 100,000 people. All rates were directly age-standardised to the European Standard Population (2013). Site: Liver Cancer (ICD-10 C22). Diagnosis year: 2021.
Source: Scotland Public Health Scotland (2023). Cancer incidence in Scotland: ‘Cancer incidence: liver’ and ‘Cancer incidence by deprivation quintile: liver’ tables. Accessed: 02/09/2023 https://www.publichealthscotland.scot/publications/cancer-incidence-in-scotland/cancer-incidence-in-scotland-to-december-2021/data-files/#Digestive%20organs.
| Region | Age standardised rate in men |
Age standardised rate in women |
Cases in men |
Cases in women |
Total cases |
| Cardiff and Vale |
22.3 | 7.2 | 42 | 17 | 59 |
| Cwm Taf Morgannwg |
18.3 | 6.3 | 38 | 15 | 53 |
| Aneurin Bevan |
17.1 | 7.5 | 49 | 25 | 73 |
| Swansea Bay |
14.9 | 4.9 | 27 | 11 | 38 |
| Betsi Cadwaladr |
13.7 | 5.9 | 52 | 26 | 78 |
| Hywel Dda | 12.4 | 5.7 | 28 | 15 | 42 |
| Powys | 11.6 | 4.7 | 10 | 4 | 14 |
Rates per 100,000 people. All rates were directly age-standardised to the European Standard Population (2013). Site: Liver And Intraheptic Bile Duct Cancer (ICD-10 C22). Diagnosis year: 2018-2020.
Source: Wales Public Health Wales (2023). Cancer Incidence in Wales, 2002 to 2002. ‘Geographical Analysis, 2002-2020’ and ‘Area Deprivation, 2002-2020’ tables. Accessed: 15/09/2023 https://phw.nhs.wales/services-and-teams/welsh-cancer-intelligence-and-surveillance-unit-wcisu/cancer-reporting-tool/official-statistics-data-tables/
Liver cancer survival
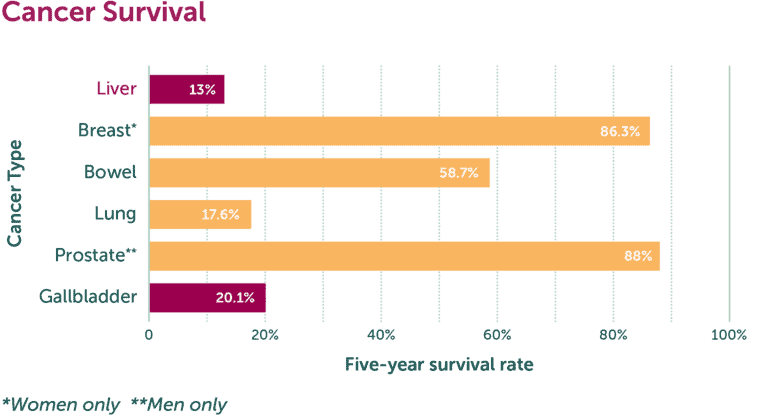
Liver cancer has one of the lowest survival rates of any cancer in the UK. Only 13% of people survive their liver cancer for 5 years or more. 14
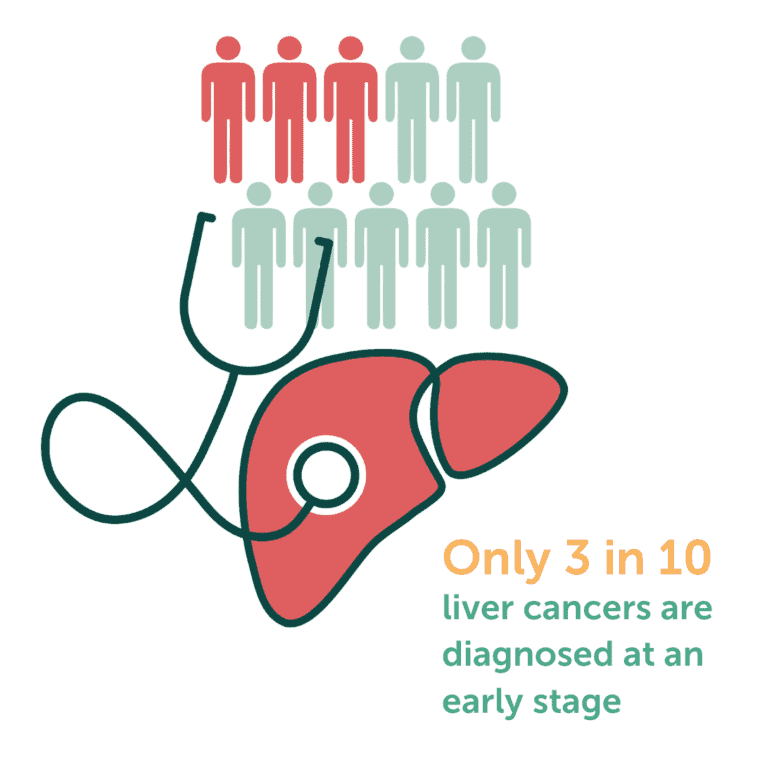
Only 3 in 10 liver cancer cases are diagnosed early at stages 1 or 2.13 Because diagnoses of liver cancer normally happen so late, it has one of the lowest survival rates out of all cancer types.
Late stage diagnosis
Cancer is more likely to be cured when it is diagnosed at an early stage, before it has spread. Sadly, liver cancer is often diagnosed at a late stage33.
The UK government has a target to diagnose three-quarters (75%) of cancers at an early stage by 2028. Early means diagnosing cancers at stage 1 or 2.
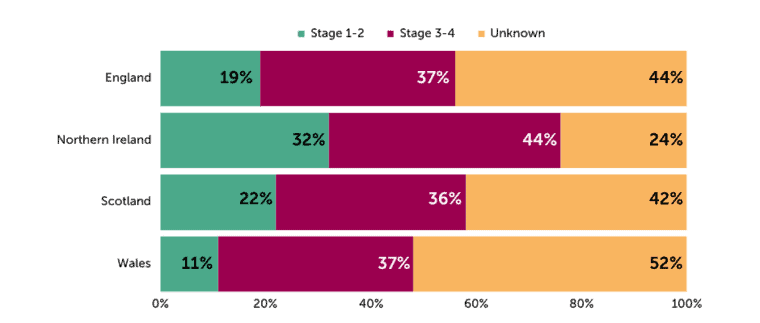
Across the UK, the proportion of cancers diagnosed at an early stage varies from around 1 in 10 (11%) in Wales to around 3 in 10 (32%) in Northern Ireland33. In all nations more people are diagnosed at a late stage than at an early one.
Worryingly a large proportion of liver cancer does not have a stage recorded. This makes it hard to understand how good we are at diagnosing liver cancer early and to measure any progress.
Liver cancer is often diagnosed in A&E as an emergency. Across the UK nations between 2012 and 2017, emergency diagnosis ranged from around 4 in 10 in Northern Ireland (37%) and England (42%) to around 5 in 10 in Scotland (48%) and Wales (50%)34.
![Bar chart showing the percentage of liver cancers diagnosed in A&E between 2012 and 2017 ranged from 37% in Northern Ireland to 50% in Wales.]](https://livercanceruk.org/wp-content/uploads/2024/02/Cancer-patients-diagnosed-through-emergency-route-by-country-1-760x323.png)
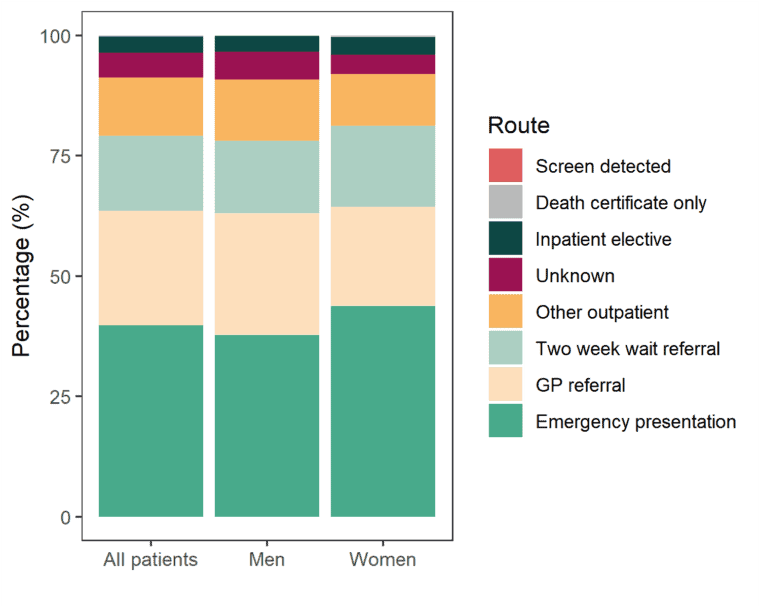
Data from England shows that 4 in 10 (40%) cases of liver cancer are diagnosed through an emergency route35. This makes it the most common route. As many people are diagnosed as an emergency as through the next 2 most common routes added together – GP referral (24%) and a 2-week wait referral (16%).
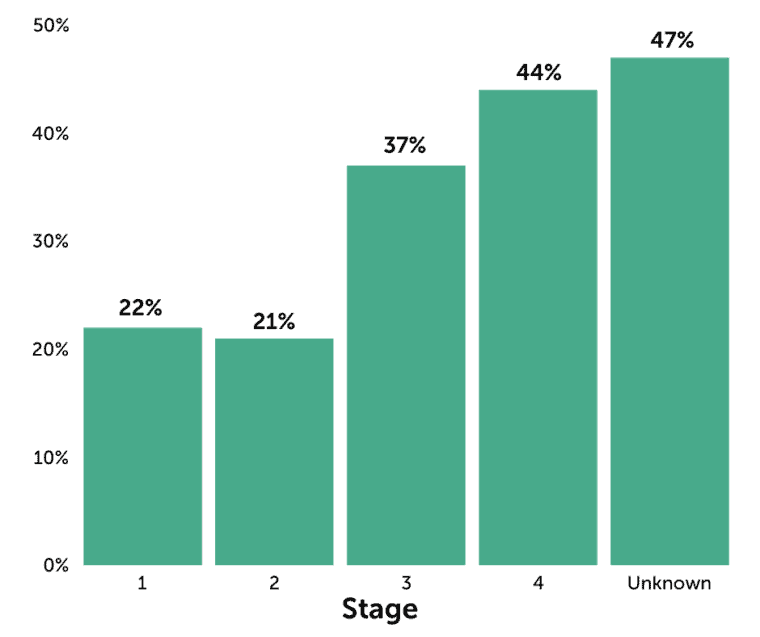
People diagnosed with late stage liver cancer are more likely to have been diagnosed through an emergency route than those with early stage disease36. In England around 4 in 10 (44 %) patients with stage 4 liver cancer are diagnosed through an emergency route, compared to around 2 in 10 ( 22 %) of those with stage 1 disease.
Types of liver cancer
There are 5 main types of cancer affecting the liver and related organs. Alongside the two most common types, hepatocellular carcinoma (HCC) and bile duct cancer, additional types include fibrolamellar cancer, angiosarcoma and gallbladder cancer.
Hepatocellular Carcinoma
- HCC is the most common type of liver cancer and accounts for more than three quarters of the world’s liver cancer cases each year.16
- The number of new HCC cases in England every year is around 2,400 in men and 600 in women.17*
Bile Duct Cancer
- Around 2,800 people in England receive a bile duct cancer diagnosis (cholangiocarcinoma) each year.18*
- Bile duct cancer can either be intrahepatic (originating within the liver) or extrahepatic (originating anywhere between the liver and small intestine). Most cases of bile duct cancer are intrahepatic – 78% of cases from 2001 to 2017.19
- From 2001 to 2017, one third of those diagnosed with bile duct cancer were under the age of 70.20
*Data for Scotland, Wales and Northern Ireland is not currently available.
Symptoms and risk factors
Liver cancer is often not diagnosed until it is too advanced for treatment to be a realistic option.
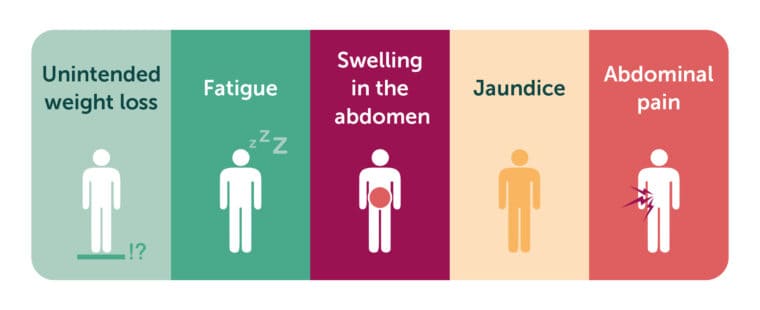
Liver cancer is often undetected until these late stages because symptoms usually take a long time to show and are not unique to liver cancer. Meaning they are hard to distinguish from symptoms of more common and less serious conditions.
The biggest risk factor for the development of liver cancer is pre-existing liver disease. An example of liver disease is cirrhosis, or serious scarring of the liver, caused by long term damage from a variety of factors.22
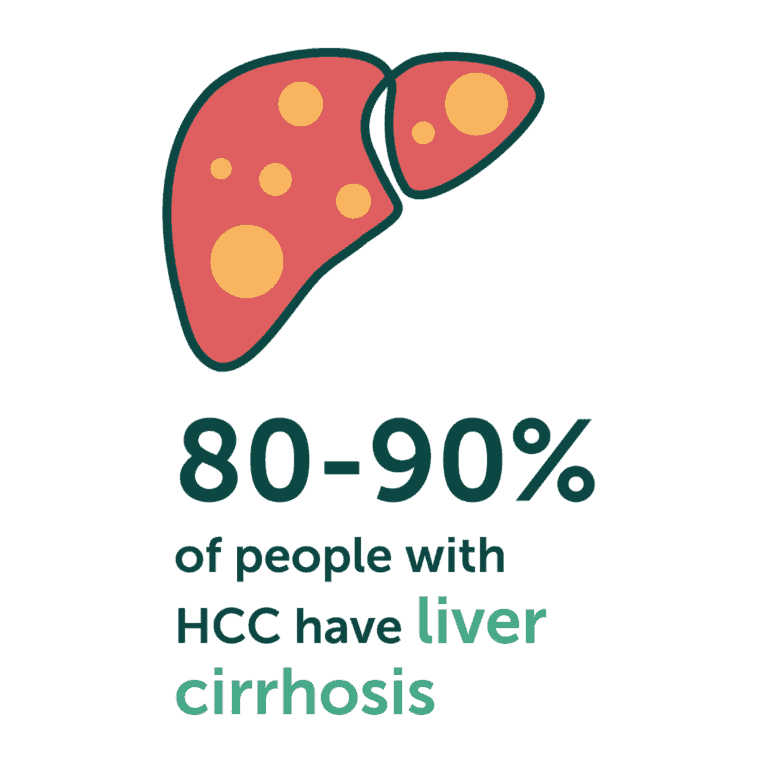
30 to 40% of people with bile duct cancer have underlying liver disease. 23 24 And 80 to 90% of people with HCC have cirrhosis. 25
Who is most likely to develop liver cancer?
Sex
Women
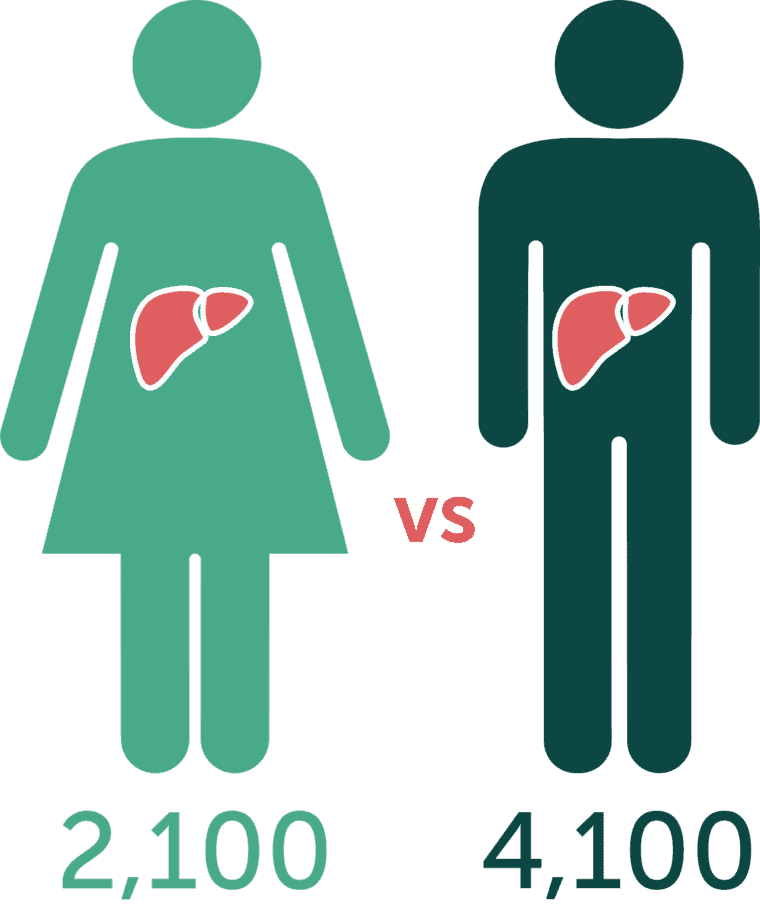
- There are around 2,100 new cases of liver cancer in women every year in the UK.8
- Intrahepatic bile duct carcinoma is the most common form of liver cancer in women.26
- Survival from liver cancer is lower for women than it is for men at both 1 and 5 years.27
Men
- There are around 4,100 new cases of liver cancer in men every year in the UK.8
- Hepatocellular carcinoma is the most common form of liver cancer in men.26
Ethnicity
The number of people diagnosed with liver cancer each year is higher in the Asian and Black ethnic groups in England. But lower in people of mixed or multiple ethnicities, compared with the White ethnic group in England.28
Age
The likelihood of getting liver cancer increases after age 40 and the rise in the number of liver cancer cases after age 40 is greater in men than women.29
Only a small proportion of liver cancer cases occur in children.29
Deprivation
A 2023 analysis of liver cancer data on behalf of Liver Cancer UK shows that liver cancer rates across the UK are linked with deprivation. In all 4 nations, liver cancer rates are highest in people from the most deprived areas 32.
- In England, the rate of liver cancer in men from the most deprived areas (21 in 100,000 people) is double the rate in men living in the least deprived areas (11 in 100,000). In women, the rate is 58% higher in women from the most deprived (8 in 100,000) compared to the least deprived (5 in 100,000) areas.
- In Northern Ireland, liver cancer rates are highest among men (17 in every 100,000) and women (6 in every 100,000) living in the most deprived areas.
- In Scotland liver cancer incidence is highest in people living in the most deprived areas of Scotland, with around 17 in every 100,000 diagnosed each year. This is over double the rate in those living in the least deprived areas (8 in 100,000).
- In Wales, the rate of liver cancer is 48% higher in men from the most deprived (20 in 100,000) compared to the least deprived (13 in 100,000) areas. Incidence is also highest among women living in the most deprived areas with 9 diagnoses in every 100,000 women each year.
A 2022 report from Cancer Research UK has found that in Scotland, cancer death rates are 74% higher in the most deprived populations than the least deprived.30
The report also estimates that around 4,900 extra cancer cases each year in Scotland are due to deprivation.30
Around 1,200 cases of liver cancer each year in England are linked with deprivation.28
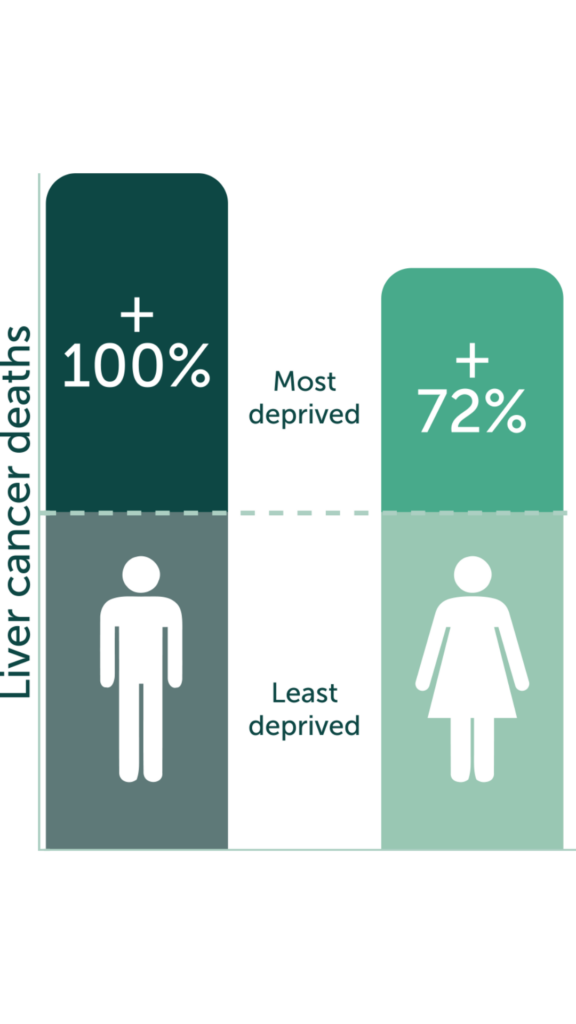
The number of liver cancer deaths is 100% higher for men living in the most deprived areas of England compared with the least deprived, and 72% higher for women.31
Note
Incidence rates for HCC were adjusted from ‘per 100k’ format to a raw approximate using ONS population figures.
References
1. Cancer Research UK (2021). Mortality trends over time for common cancers. Available at: https://www.cancerresearchuk.org/health-professional/cancer-statistics/mortality/common-cancerscompared#heading-Three (last accessed March 2023).
2. In-house analysis of deaths over the years 2019 to 2023. Data sources: England and Wales data were accessed from Nomis mortality statistics by underlying cause (ICD10 C22), sex and age, https://www.nomisweb.co.uk/ accessed December 2024. Northern Ireland Statistics and Research Agency Registrar General Annual Report 2023 Cause of Death, https://www.nisra.gov.uk/publications/registrar-general-annual-report-2023-cause-death includes ICD-10 C22, accessed December 2024. National Records of Scotland vital events reference table 2023 https://www.nrscotland.gov.uk/publications/vital-events-reference-tables-2023/ includes ICD-10 C22, accessed December 2024.
3. ONS data for England and Wales were accessed from Nomis mortality statistics for 2023 by underlying cause (ICD-10 C22) https://www.nomisweb.co.uk/ (accessed December 2024).
4. Northern Ireland Statistics and Research Agency Registrar General Annual Report 2023 Cause of Death, https://www.nisra.gov.uk/publications/registrar-general-annual-report-2023-cause-death includes ICD-10 C22 (accessed December 2024).
5. National Records of Scotland vital events reference table 2023 https://www.nrscotland.gov.uk/publications/vital-events-reference-tables-2023/ includes ICD-10 C22 (accessed December 2024).
6. Cancer Research UK (2021). Incidence trends over time for common cancers. Available at: https://www.cancerresearchuk.org/health-professional/cancer-statistics/incidence/common-cancerscompared#heading-Three (last accessed March 2023).
7. Cancer Research UK (2021). Thyroid cancer incidence trends over time. Available at: https://www.cancerresearchuk.org/health-professional/cancer-statistics/statistics-by-cancer-type/thyroid-cancer/incidence#heading-Two (last accessed March 2023).
8. Cancer Research UK (2021). Liver cancer incidence by sex and UK country. Available at: https://www.cancerresearchuk.org/health-professional/cancer-statistics/statistics-by-cancer-type/liver-cancer/incidence#heading-Zero (last accessed March 2023).
9. NHS Digital (2022). Cancer incidence and mortality. Available at: https://www.cancerdata.nhs.uk/incidence_and_mortality (last accessed March 2023).
10. Public Health Scotland (2020). Cancer Statistics: Liver Cancer. Available at: https://www.isdscotland.org/health-topics/cancer/cancer-statistics/liver/ (last accessed March 2023).
11. Welsh cancer Intelligence and Surveillance Unit (2022). Cancer Incidence in Wales, 2002 to 2019. Available at: https://phw.nhs.wales/services-and-teams/welsh-cancer-intelligence-and-surveillance-unit-wcisu/cancer-incidence-in-wales-2002-2019/ (last accessed March 2023).
12. Northern Ireland Cancer Registry. Liver cancer. https://www.qub.ac.uk/research-centres/nicr/CancerInformation/official-statistics/BySite/Livercancer/ (last accessed March 2023).
13. Office for National Statistics (2019). Cancer Survival in England – adults diagnosed. Available at:
https://www.ons.gov.uk/peoplepopulationandcommunity/healthandsocialcare/conditionsanddiseases/datasets/cancersurvivalratescancersurvivalinenglandadultsdiagnosed (last accessed March 2023).
14. Nuffield Trust (2022). Cancer survival rates. Available at: https://www.nuffieldtrust.org.uk/resource/cancer-survival-rates (last accessed March 2023).
15. Cancer Research UK. One- and five- year survival for gallbladder cancer. Available at:
https://www.cancerresearchuk.org/health-professional/cancer-statistics/statistics-by-cancer-type/gallbladder-cancer/survival#heading-Zero (last accessed March 2023).
16. Wong, M.C.S., et al. (2017). International incidence and mortality trends of liver cancer: a global profile. Scientific Reports, 7(1). Available at: https://pubmed.ncbi.nlm.nih.gov/28361988/
17. National Cancer Research Institute (2019). Deaths from liver cancer have tripled in past 20 years in England. medicalxpress.com. Available at: https://medicalxpress.com/news/2019-11-deaths-liver-cancer-tripled-years.html
18. Cancer Research UK (2021). What is bile duct cancer? Available at: https://www.cancerresearchuk.org/about-cancer/bile-duct-cancer/about (last accessed March 2023).
19. Genus, Tataru et al (2020). AMMF Incidence and Mortality Rates of Cholangiocarcinoma in England. Available at: https://ammf.org.uk/wp-content/uploads/2020/02/Incidence_Mortality_Poster_ESMO-GI_July_2019.pdf
20. Professor Shahid A Khan (2020). An Overview of Cholangiocarcinoma. Available at: https://ammf.org.uk/wp-content/uploads/2020/11/1.CCA_AMMF_Pt-day_29oct2020.pdf
21. Cancer Research UK (2021). Symptoms of liver cancer. Available at: https://www.cancerresearchuk.org/about-cancer/liver-cancer/symptoms (last accessed March 2023).
22. NHS (2020). Overview: Cirrhosis. Available at: https://www.nhs.uk/conditions/cirrhosis/
23. Selvadurai S, et al, (2021). Cholangiocarcinoma miscoding in hepatobiliary centres. European Journal of Surgical Oncology. Available at: https://doi.org/10.1016/j.ejso.2020.09.039
24. Pericleous M and Khan SA (2019). Epidemiology of HPB Malignancy in the Elderly. Available at: https://pubmed.ncbi.nlm.nih.gov/32360064/
25. Nordenstedt H, White DL, El-Serag HB (2010). The changing pattern of epidemiology in hepatocellularcarcinoma. Available at: https://pubmed.ncbi.nlm.nih.gov/20547305/#:~:text=Cirrhosis%20is%20present%20in%20about,90%25%20of%20all%20HCC%20worldwide (last accessed March 2023).
26. Cancer Research UK (2022). Liver cancer incidence by atomical site. Available at: https://www.cancerresearchuk.org/health-professional/cancer-statistics/statistics-by-cancer-type/liver-cancer/incidence#heading-Three (last accessed March 2023).
27. Cancer Research UK (2020). One- and five- year survival for liver cancer. Available at: https://www.cancerresearchuk.org/health-professional/cancer-statistics/statistics-by-cancer-type/liver-cancer#heading-Two (last accessed March 2023).
28. Cancer Research UK. Liver cancer incidence. Available at: https://www.cancerresearchuk.org/health-professional/cancer-statistics/statistics-by-cancer-type/liver-cancer#heading-Zero (last accessed March 2023).
29. Cancer Research UK (2021). Liver cancer incidence by age. Available at: https://www.cancerresearchuk.org/health-professional/cancer-statistics/statistics-by-cancer-type/liver-cancer/incidence#heading-One (last accessed March 2023).
30. Cancer Research UK (2022). Cancer Research UK report highlights stark cancer inequalities across Scotland. Available at: https://www.cancerresearchuk.org/sites/default/files/cancer_in_the_uk_-_deprivation_and_cancer_inequalities_in_scotland.pdf
31. Cancer Research UK (2016). Deprivation gradient in liver cancer mortality. Available at: https://www.cancerresearchuk.org/health-professional/cancer-statistics/statistics-by-cancer-type/liver-cancer/mortality#heading-Four (last accessed March 2023).
32. Analysis of cancer incidence data on behalf of Liver Cancer UK, carried out by Dr Becky White, 2023. All rates were directly age-standardised to the European Standard Population (2013). 95% confidence intervals were used to calculate statistically significant differences. Deprivation statistics are from the Index of Multiple Deprivation (IMD) and compare patients living in the most and least deprived quintiles.
England Site: Liver And Intraheptic Bile Duct Cancer (ICD-10 C22). Diagnosis year: 2020. NHS Digital (2022). Cancer Registration Statistics, England 2020. Accessed: 15/09/2023. https://digital.nhs.uk/data-and-information/publications/statistical/cancer-registration-statistics/england-2020.
Northern Ireland Site: Liver And Intraheptic Bile Duct Cancer (ICD-10 C22). Diagnosis year: 2016-2020. Northern Ireland Northern Ireland Cancer Registry. Liver cancer statistics: 1993-2020. Accessed: 02/09/2023 https://www.qub.ac.uk/research-centres/nicr/CancerInformation/official-statistics/BySite/Livercancer/ .
Scotland Site: Liver Cancer (ICD-10 C22). Diagnosis year: 2021. Scotland Public Health Scotland (2023). Cancer incidence in Scotland: ‘Cancer incidence: liver’ and ‘Cancer incidence by deprivation quintile: liver’ tables. Accessed: 02/09/2023 https://www.publichealthscotland.scot/publications/cancer-incidence-in-scotland/cancer-incidence-in-scotland-to-december-2021/data-files/#Digestive%20organs.
Wales Site: Liver And Intraheptic Bile Duct Cancer (ICD-10 C22). Diagnosis year: 2018-2020. Wales Public Health Wales (2023). Cancer Incidence in Wales, 2002 to 2002. ‘Geographical Analysis, 2002-2020’ and ‘Area Deprivation, 2002-2020’ tables. Accessed: 15/09/2023 https://phw.nhs.wales/services-and-teams/welsh-cancer-intelligence-and-surveillance-unit-wcisu/cancer-reporting-tool/official-statistics-data-tables/
33. Analysis carried out on behalf of the British Liver Trust by Dr Becky White. Sources: England National Disease Registration Service (NDRS) (2023). Cancer Survival in England. Accessed: 02/09/2023 https://digital.nhs.uk/data-and-information/publications/statistical/cancer-survival-in-england/cancers-diagnosed-2016-to-2020-followed-up-to-2021 . TNM staging system. Unknown stage includes ‘unstageable’. Site: Liver And Intraheptic Bile Duct Cancer (ICD-10 C22) Year: 2016-2020. Wales Public Health Wales (2022). Cancer Incidence in Wales, 2002 to 2019. Accessed: 02/09/2023 https://phw.nhs.wales/services-and-teams/welsh-cancer-intelligence-and-surveillance-unit-wcisu/cancer-incidence-in-wales-2002-2019/ . TNM staging system. Site: Liver And Intraheptic Bile Duct Cancer (ICD-10 C22). Year: 2017-2019. Scotland Public Health Scotland (2023). Cancer incidence in Scotland: Cancer incidence by deprivation: liver. Accessed: 02/09/2023 https://www.publichealthscotland.scot/publications/cancer-incidence-in-scotland/cancer-incidence-in-scotland-to-december-2021/data-files/#Staging . TNM staging system. Site: Liver Cancer (ICD-10 C22.0-C22.1). Year: 2021. Northern Ireland Northern Ireland Cancer Registry. Liver cancer statistics: 1993-2020. Accessed: 02/09/2023 https://www.qub.ac.uk/research-centres/nicr/CancerInformation/official-statistics/BySite/Livercancer/ . TNM UICC 7 (2013-2017) or UICC 8 (2018+) staging systems.. Site: Liver And Intraheptic Bile Duct Cancer (ICD-10 C22). Year: 2016-2020.
34. Source: McPhail, S. et al. (2022). Risk factors and prognostic implications of diagnosis of cancer within 30 days after an emergency hospital admission (emergency presentation): an International Cancer Benchmarking Partnership (ICBP) population-based study. The Lancet. Oncology, 23(5), 587–600. Link: https://doi.org/10.1016/S1470-2045(22)00127-9 Notes: Liver And Intraheptic Bile Duct Cancer ( ICD-10 C22 ), 2012-2017 * For some countries (incl. England and Northern Ireland), proportions may be lower because a narrower definition of emergency presentations was used.
35. Analysis carried out on behalf of the British Liver Trust by Dr Becky White. Source: NHS Digital (2022). Routes to Diagnosis, 2018. Accessed: 02/09/2023 Link: https://digital.nhs.uk/data-and-information/publications/statistical/routes-to-diagnosis/2018 Notes: Liver And Intraheptic Bile Duct Cancer ( ICD-10 C220-4, C227, C229 ), 2018
36.Analysis carried out on behalf of the British Liver Trust by Dr Becky White. Source: NHS Digital (2022). Routes to Diagnosis, 2018. Accessed: 02/09/2023 Link: https://digital.nhs.uk/data-and-information/publications/statistical/routes-to-diagnosis/2018 Notes: Liver And Intraheptic Bile Duct Cancer ( ICD-10 C220-4, C227, C229 ), 2018

